ImageJ Plugins
3D Color Inspector
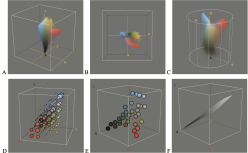
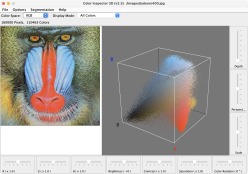
This 3D Color Inspector plugin shows the color distribution of an image within a 3D color space. The viewing angle can be adjusted with the mouse. Eleven different color spaces and five display modes are supported. By switching between color spaces, the relationship between different color spaces can be made visible. In addition, the effect of image manipulations can be studied on an image and the corresponding color distribution. Extensive documentation is available here.
Image Synthesizer
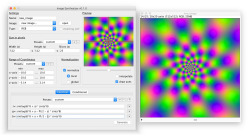
This plugin generates images from mathematical functions and primitive patterns in a predefined coordinate system. It can be used to synthesize test cards to analyze for example the behavior of filter operations or to test the functionality of various image processing algorithms. The tool can also be used in a teaching environment, where example images for presentations can be prepared or even to demonstrate basic principles of digital image processing. Further on, an artistic use to create images stacks or videos, is also imaginable. Image Synthesizer is also available as a stand-alone program. Github Link
Volume Viewer
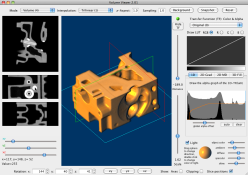
For high quality 3D volume renderings transfer functions have be defined. Typically, 1D transfer functions are used that assign a color and an alpha value to every intensity value of the volume data. 2D transfer functions use the gradient of the volume data as additional dimension to assign colors and alpha values. This Volume Viewer does automatic proposals for 1D or 2D transfer functions that will lead to pleasing volume renderings. These transfer functions serve as a starting point but they still can be modified to change the way the volume data is rendered.
Interactive 3D Surface Plot
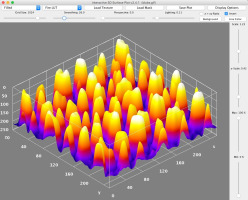
This plugin creates interactive surface plots from all ImageJ image types. Selections, which can be non-rectangular, are supported. The luminance of an image is interpreted as height for the plot. Internally the image is scaled to a square image using nearest neighbor sampling. For selections the bounding box of the selection is used for the surface plot. The viewing position of the plot can be adjusted with the mouse. Double click on the plot to show it from the top, triple click on it to show it from the front.
Mean Shift Filter
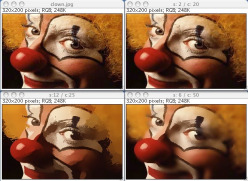
This plugin is a very simple implementation of a mean shift filter that can be used for edge-preserving smoothing or for segmentation. Important edges of an image might be easier detected after mean shift filtering. It uses a circular flat kernel and the color distance is calculated in the YIQ color space. For each pixel of an image, the set of neighboring pixels is determined. For this set of neighbor pixels, the new spatial center (spatial mean) and the new color mean value are calculated. These calculated mean values will serve as the new center for the next iteration. At the end, the final mean color will be assigned to the starting position.
